Sounds in the Key of the Sea
Air Date: Week of October 5, 2012

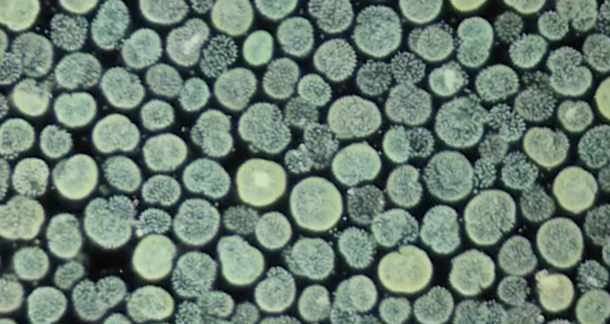
Cyanobacteria colonies. (Photo: Specious Reasons)
Peter Larsen is a biologist not a musician, but he has produced catchy musical interpretations of microbial communities and other scientific data collected from a buoy in the English Channel. He explained to host Steve Curwood how he transmuted scientific data into music.
Transcript
CURWOOD: From the symmetry of ferns to spiraling Nautilus shells, there are patterns in nature wherever we look. But scientists at the Argonne National Laboratory have turned to music to reveal patterns in the ocean otherwise invisible to the human eye.
Joining us now from The Argonne National Lab just outside Chicago is the biologist responsible for what he calls "Microbial Bebop," Peter Larsen. Welcome to Living on Earth!
LARSEN: Glad to be here Steve, thanks for inviting me!
CURWOOD: So where did you get this idea to represent microbial data musically?
LARSEN: First of all, my principal job is to represent complex data sets in a way that reveals patters that are intuitive to a human viewer. There have been other recent attempts to make audio versions of complex data. These have been from DNA sequences, protein sequences as well as things like earthquake data. So it was an interesting opportunity to approach a complex dataset from a novel direction.
CURWOOD: What’s the study that produced this data?
LARSEN: This particular study is a long-term environmental project at the Western English Channel. Particularly, this data comes from a single location - the L4 station.
CURWOOD: And could you describe exactly what the data is all about?
LARSEN: The L4 station is an automated buoy. It automatically collects data about the physical parameters of the ocean: temperature, salinity, chlorophyll. For the last decade or so, scientists in that area have been regularly going out and sampling the microbial diversities in that location. So we have a long-standing time course of microbial population diversity at a single location in the ocean.
CURWOOD: So, we’ve got time, we’ve got microbial presence, we’ve got temperature, we have salinity… all of those things rolled together.
LARSEN: That’s right.
CURWOOD: How did you turn this data into music?
LARSEN: One of the things that I wanted to get most out of this approach was to highlight relationships between two different kinds of data. So, in most of the pieces that we have posted, the melody is derived from a numerical measurement, such that the lowest measure is the lowest note and the highest measure is the highest note.
The other component is the chords. And the chords map to a different component of the data. A particular combination of data will sound different to a human listener if it’s played in the key of temperature, then it would if it was played in the key of phosphorous.
CURWOOD: (Laughs).The key of temperature vs. the key of phosphorous?
LARSEN: Exactly.
CURWOOD: (Laughs.) OK. Got your ears ready?
LARSEN: Absolutely.
CURWOOD: Let’s go ahead and play a few of these songs for you. First we have this microbial composition called bloom.
[MUSIC: Sounds Of The Sea : Pieces include “Bloom”, “Far & Wide”, “Blues For Elle” and “50 Degrees North”. From Microbial Bebop. Produced at the Argonne National Laboratory.]
LARSEN: So, what we’re hearing here is the measurements of microbial abundances of microbes that are typically very low abundance of population but occasionally bloom and become major players in the population. So we’re listening to 10 years of microbial data. Each measure that you hear is a single observation; 12 observations per year, seven years in the entire set. On occasion you’ll notice that the normally low melody notes will give a little spike - a high note. That maps to a bloom microbial abundance of a particular species.
[MUSIC CONTINUES: BLOOM]
CURWOOD: OK… So, let’s listen to the next one. You call this Far and Wide.
[MUSIC: FAR AND WIDE]
LARSEN: OK. So in this case, we are hearing the abundance of a single microbial species. This one is called Rickettsiales. Rickettsiales is the most commonly observed bacterial species in this location in the ocean. Again, every measure is a particular observation. The chords in this case are derived from day length and water temperature. We added some additional information to this one: every time you hear that symbol crash - that is an observation which Rickettsiales is the most abundant microbe at that particular observation.
[MUSIC CONTINUES.]
CURWOOD: That’s a pretty busy microbe you mapped there with the sound, huh?
LARSEN: There’s a tremendous amount of data that’s produced by these kinds of experiments - terabytes and terabytes of data are derived by these analyses. Although the music, perhaps, is a less rigorous approach. Certainly one of the things we want to do with this data is find ways to approach very complex data and identify those underlying patterns.
CURWOOD: OK. And we’ve got one more song here from your microbes. This one you call Blues for Elle:
[MUSIC: BLUES FOUR L]
LARSEN: Blues for Elle. Again this is for the L4 station. So this is the L4 Blues. We’ve arranged with a slightly more provocative title in Blues for Elle. This is strictly looking at the seasonal patterns in the physical conditions of the L4 station where the chords in this case are photosynthetic reactive radiation and the melody is comprised of 8 notes per measure. Each note is a particular measure of the chemical nature of the water: nitrate, salinity, silica,concentration of silica, the concentration of chlorophyll, the concentration of nitrates. These are parameters that have a very distinct seasonal pattern.
[MUSIC CONTINUES]
CURWOOD: Blues? Does that affect the color of the sea?
LARSEN: (Laughs.) One of the allowances I gave myself is the occasional very bad pun, yes.
CURWOOD: So, how can the songs themselves help us understand the data?
LARSEN: Songs themselves probably are never going to actively replace, you know, the bar graph for data analysis, but I think that this kind of translation of complex data into a very accessible format is an opportunity to lead people who probably aren’t highly aware of the importance of microbial ecology in the ocean, and give them a very appealing entry into this kind of data.
CURWOOD: Why are patterns in the ocean of microbial life important in the big picture?
LARSEN: In the bigger picture, microbes are in some sense the dominant form of life on earth. Microbes are predominantly the largest collection of life on earth by biomass. Microbes drive every biogeochemical cycle on earth. In the ocean, 98 percent of the ocean’s primary productivity, the ocean’s ability to turn sunlight through primary productivity into food for the rest of the ocean, is driven by these microbial species. If we are to understand the consequences of the changing environment, we need to understand how this very very critical portion of the biogeochemical cycles are going to be affected by rising temperatures in the ocean, rising salinity, and changes pH.
CURWOOD: Peter Larson is a biologist at the US Department of Energy’s Argonne Laboratory. Thanks very much for being with us today.
[MUSIC CONTINUES: Sounds Of The Sea : “50 Degrees North”. From Microbial Bebop. Produced at the Argonne National Laboratory.]
LARSEN: Thanks very much for inviting me!
Links
Living on Earth wants to hear from you!
Living on Earth
62 Calef Highway, Suite 212
Lee, NH 03861
Telephone: 617-287-4121
E-mail: comments@loe.org
Newsletter [Click here]
Donate to Living on Earth!
Living on Earth is an independent media program and relies entirely on contributions from listeners and institutions supporting public service. Please donate now to preserve an independent environmental voice.
NewsletterLiving on Earth offers a weekly delivery of the show's rundown to your mailbox. Sign up for our newsletter today!
 Sailors For The Sea: Be the change you want to sea.
 The Grantham Foundation for the Protection of the Environment: Committed to protecting and improving the health of the global environment.
 Contribute to Living on Earth and receive, as our gift to you, an archival print of one of Mark Seth Lender's extraordinary wildlife photographs. Follow the link to see Mark's current collection of photographs.
 Buy a signed copy of Mark Seth Lender's book Smeagull the Seagull & support Living on Earth

